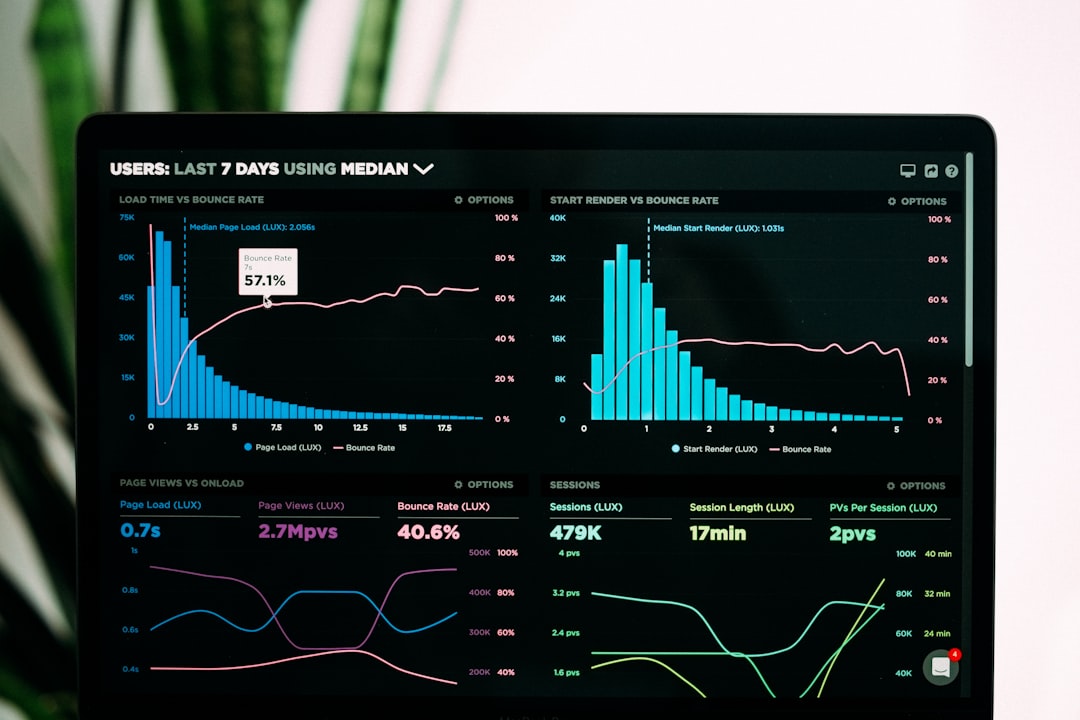
You refresh your analytics dashboard, see a 1.8% conversion rate, and think: is that good or terrible? Maybe you've been running your store for six months and have no idea whether to celebrate or panic. That moment of uncertainty is exactly where e-commerce platform conversion rate benchmarks become genuinely useful — not as a stick to beat yourself with, but as a compass.
Let me walk you through what the numbers actually look like across platforms, why they vary so much, and — most importantly — what you can do about it starting today.
What "Conversion Rate" Actually Means Here
Before we dig into benchmarks, quick definition: your store's conversion rate is the percentage of sessions that end in a purchase. If 500 people visit and 10 buy, that's a 2% conversion rate. Simple math, but the inputs get complicated fast.
Platform matters because checkout UX, page speed, and built-in trust signals differ meaningfully between Shopify, WooCommerce, BigCommerce, Wix, Squarespace, and headless setups. The platform you're on shapes the ceiling — and the floor — of what's realistic for you.
The Benchmark Numbers You Actually Need
Across the e-commerce industry, the widely cited average conversion rate sits between 1.5% and 3%. IRP Commerce's 2024 sector data puts the overall average at around 1.82%, while Shopify's own merchant data has historically shown averages closer to 1.4% when you include stores at every stage of maturity. LittleData's 2023 Shopify benchmark report found that a rate above 3.3% puts you in the top 20% of Shopify stores — and above 4.7% lands you in the top 10%.
Here's a quick platform-by-platform snapshot based on aggregated industry reporting:
- Shopify — Average: 1.4%–1.8%. Top quartile: 3.2%+. Shopify's one-page checkout (rolled out broadly in 2023) has helped many stores nudge rates up by 0.3–0.5 percentage points.
- WooCommerce — Average: 1.5%–2.1%. Rates vary wildly because WooCommerce stores control their own hosting and checkout plugins. A slow host can cut conversion by 20–30% on its own.
- BigCommerce — Average: 1.5%–2.0%. Merchants using BigCommerce's native checkout report slightly fewer cart-abandonment events than those on heavily customized setups.
- Wix eCommerce — Average: 1.0%–1.6%. Lower baseline, partly because Wix attracts newer sellers with less optimized funnels. Not a ceiling — just a starting point.
- Squarespace Commerce — Average: 0.9%–1.5%. Similar story: the platform is easier to launch on, so many stores are earlier in their optimization journey.
- Headless / custom builds — Varies enormously: 1.2%–5%+. The range is huge because headless setups can be blazing fast or a mess of tech debt. Speed-optimized headless storefronts for established brands often hit 3.5–5%.
Think of these as reference points, not verdicts. A 1.6% rate on WooCommerce with a niche product and cold traffic is very different from a 1.6% rate on Shopify with a warm email list.
Why Your Platform Is Only Part of the Story
Here's the honest truth: platform choice explains maybe 15–20% of your conversion rate. The rest comes from factors you control regardless of where your store lives.
Traffic quality is the big one. If you're running broad top-of-funnel Facebook ads to a general audience, a 1% conversion rate might be fine — you're paying for awareness. If you're sending existing customers an email about a product they already love, 8–12% is achievable. Same store, wildly different numbers.
Product-market fit matters more than any checkout tweak. A store selling a commodity item at average prices in a crowded market will struggle to hit 2% no matter how polished the UX is.
Average order value (AOV) plays a role too. Stores selling $500+ items typically convert at 0.5%–1.5% — shoppers take longer to decide. Stores selling $20–$40 impulse-friendly products regularly hit 3–5%.
So when you look at your conversion rate against e-commerce platform conversion rate benchmarks, segment first. What's your traffic source? What's your AOV? What's your product category?
Three Things You Can Do Today to Move the Number
Okay, enough context — here's where it gets actionable. These three moves work across platforms and don't require a developer.
1. Run a checkout friction audit (takes 20 minutes)
Pull up your own checkout on a mobile device — because 60–70% of your traffic is probably mobile — and go through the entire purchase flow as a stranger would. Count every tap required before the order confirmation screen. Industry data from Baymard Institute suggests the average checkout has 23.5 unnecessary form fields. Removing required fields that aren't essential (like a second phone number field or a fax line, yes, those still exist) can lift completion rates by 10–20%.
If you're on Shopify, enable accelerated checkouts like Shop Pay, Apple Pay, and Google Pay. Stores that do this see an average 9–18% improvement in mobile conversion, per Shopify's internal data.
2. Fix your slowest page (free, this afternoon)
Run your homepage and your most-visited product page through Google PageSpeed Insights. A one-second delay in load time reduces conversions by roughly 7%, according to Akamai research. If your score is below 60 on mobile, you have a clear opportunity.
The most common culprits: uncompressed images, too many third-party scripts (chat widgets, review apps, loyalty apps all add load time), and unoptimized theme code. Start by compressing every image on your product pages using a free tool like Squoosh. That alone often cuts page weight by 40–60%.
3. Add one trust signal above the fold on your product page
Baymard's research consistently shows that lack of trust is a top-three reason shoppers abandon without buying. You don't need a wall of badges — one well-placed element works. A real customer review count ("4.8 stars from 312 buyers"), a clear return policy line ("Free returns within 30 days"), or a security badge near the Add to Cart button can move conversion by 5–15% on stores that previously had none.
Pick one, add it, give it two weeks of traffic, and check your numbers. Don't change five things at once or you'll never know what worked.
A Quick Example: What a 0.5% Lift Actually Means
Let's make this concrete. Say your store does 8,000 sessions a month with a $65 AOV and a current conversion rate of 1.8%.
- Current monthly revenue: 8,000 × 1.8% × $65 = $9,360
- At 2.3% (a 0.5-point lift): 8,000 × 2.3% × $65 = $11,960
That's $2,600 more per month — $31,200 annualized — without spending a dollar more on ads or acquiring a single new visitor. This is why conversion rate optimization gets so much attention from operators who've been around long enough to run the math.
A store I know in the home goods space made exactly this jump after switching from a three-page checkout to a single-page checkout on WooCommerce (using a paid plugin that cost $89/year) and compressing their product images. Two changes, six weeks, $2,400 in additional monthly revenue. Not magic — just removing friction.
How to Set a Realistic Conversion Rate Goal
Rather than chasing a universal benchmark, here's a smarter framework:
- Find your current baseline. Pull 90 days of data, not 7. Short windows are noisy.
- Segment by traffic source. Your organic search visitors probably convert at 2–3×the rate of cold paid traffic. Know both numbers.
- Set a 10–20% improvement target over 60 days. If you're at 1.8%, aim for 2.0–2.2% — not 4%. Realistic targets keep you focused on the right levers.
- Pick one variable to test at a time. Checkout fields, trust badges, product page layout, shipping threshold messaging — one at a time.
- Revisit benchmarks quarterly. Seasonality is real. A 1.4% rate in January might be perfectly healthy; the same rate in November during your peak season is a problem.
Are you currently tracking conversion rate by traffic source, or just looking at the blended number? If it's the blended number, that's your first action item — segment it in Google Analytics 4 or whatever analytics tool you use. You'll immediately see where your real opportunity is.
You're Closer Than You Think
If you've read this far, you're already thinking more carefully about conversion rates than most small store owners do. That puts you ahead.
E-commerce platform conversion rate benchmarks are useful guardrails, but they're not destiny. A 1.4% rate on Shopify today can be a 2.5% rate in 90 days with focused, methodical work on checkout friction, page speed, and trust signals. None of that requires a big budget or a developer on retainer.
Here's your one next step: open Google PageSpeed Insights right now, run your top product page, and screenshot the result. That screenshot becomes your before picture. Everything you do from here is measurable against it.
You've got this.